Three typical methods teach you how to measure noise figure
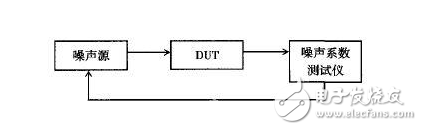
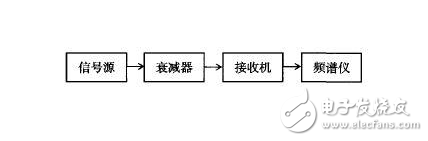
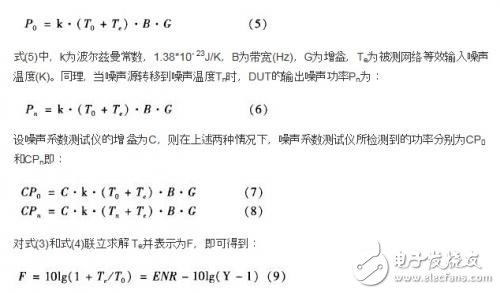
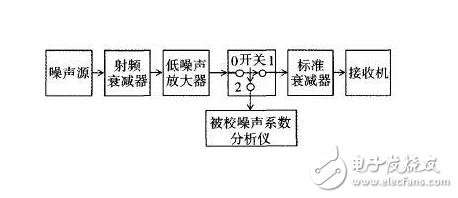
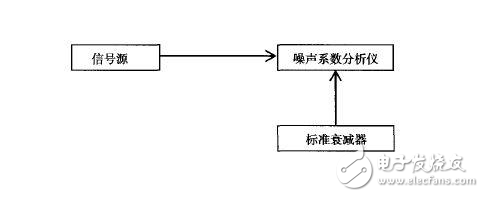
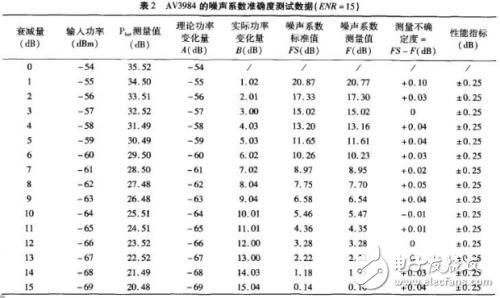
introduction The noise figure is one of the main measurement parameters in the development and production of microwave products. It is one of the key parameters to characterize the ability of receivers and their components to handle weak signals in the presence of thermal noise. The measurement of noise figure is The important content of noise measurement test. The noise factor (F) is defined in the engineering. If the linear two-port network has certain input and output terminals, and the input source impedance is at 290.K (room temperature), the signal noise power ratio of the network input terminal and the signal of the network output end. The ratio of the noise power ratio. Among them, Si is the input signal power, Ni is the input noise power, So is the output signal power, No is the output noise power, G is the two-port network gain, and Na is the noise power of the two-port network itself. It clearly indicates the multiple of the signal-to-noise ratio of the network input signal after the transmission of the network signal is degraded due to the noise generated by the network, that is, the contribution of the transmission network to the total noise power at its output. The noise figure (NF) is a logarithmic representation of the noise factor and is defined as follows: Repeatable, high-precision noise figure measurement methods are very important. Three typical methods are discussed in this paper: noise tester method, gain method and Y-factor method, and the accuracy of Y-factor method is verified by experiments. 1 noise tester method Using a noise tester is the most straightforward way to measure noise figure and is the most accurate in most cases. Engineers can measure noise figure over a specific frequency range. The noise tester can simultaneously display gain and noise figure to aid measurement. The test schematic diagram of the noise tester is shown in Figure 1. Figure 1 noise tester method schematic The core of the noise tester's noise figure is the Y-factor method. First, the noise tester itself is a receiver that can be used to test the input noise power. Secondly, the noise tester needs to control the power-on and un-powered state of a noise source to test the DUT. A noise figure tester, such as the AV3984 noise figure analyzer, produces a 28 VDC pulse signal driven noise source (AV16604) that produces a noise-driven DUT. The noise figure of the DUT is due to the input noise and signal-to-noise ratio of the noise source known to the analyzer. Can be calculated internally and displayed on the screen. Using a noise figure tester is the most straightforward way to measure noise figure. The surveyor can measure the noise figure over a specific frequency range. Typically, the noise analyzer is more accurate in ultra-low noise measurements, and the measurement results are inaccurate when measuring very high noise figures. 2 gain method At present, the noise figure is mainly measured by a dedicated noise figure tester, but when the special equipment is not available or the required test frequency range is out of range, the spectrum analyzer can be used to measure the noise figure, that is, the gain method. The device under test can be measured in the frequency range of the spectrum analyzer used. A measurement formula can be obtained based on the definition of the noise figure: In equation (3), Pout is the measured noise power spectral density, -174 dBm/Hz is the power spectral density of ambient noise at 290 °K (room temperature), BW is the frequency bandwidth of interest, and Gain is the gain of the system. Each variable in equation (3) is a logarithm. To simplify the formula, we can directly measure the output noise power spectral density (dBm/Hz), at which time equation (3) becomes: Taking the receiver as an example, the test principle is shown in Figure 2. Figure 2 gain method test block diagram The gain of the receiver is measured by the signal source and the spectrum analyzer (the range of levels that can be received by the receiver is acceptable. If the noise figure is close to the small signal of the receiver, the proximity sensitivity level can be selected, such as less than - 100 dBm signal strength); to obtain a stable and accurate noise density reading, choose the optimal resolution bandwidth (RBW) and video bandwidth (VBW) to make the noise floor on the spectrum analyzer look cleaner. The smaller the video bandwidth, the smaller the noise floor displayed on the analyzer and the more accurate the Pout reading. This method can be applied to any frequency range as long as the spectrum analyzer allows it. Often noise analyzers are more accurate in ultra-low noise measurements. This method is also very accurate in situations where the system gain is very high and the noise figure is very high. The biggest limitation comes from the noise floor of the spectrum analyzer. 3 Y coefficient method The Y-factor method is a typical method for measuring the noise figure. The Y coefficient is the ratio of the two corresponding utilized noise powers obtained at the output of the DUT when the input of the device under test (DUT) is at two different sources of noise power. The noise source is an indispensable device for the Y-factor measurement. The noise source is a noise generator that can generate two different noise powers. Generally, the DC pulse power supply is required to drive the voltage. When the DC drive voltage is supplied, it is equivalent to the noise source. In the hot state, a large noise power is output at this time; when the DC driving power is turned off, it is equivalent to the noise source being turned off, which is called a cold state, and at this time, the noise power at normal temperature is output. The difference between the thermal temperature and the cold temperature of the noise source is called the noise-to-noise ratio (ENR) of the noise source. The test principle is shown in Figure 1. To further illustrate its working principle, its working equation is derived below. When the noise source shifts to the noise temperature T0, the output power Pn of the DUT is: Where, ENR is the noise-to-noise ratio (dB) of the noise source, Y=CPn/CP0, the power ratio, commonly referred to as the Y-factor, and F is the noise figure (dB). Figure 3 shows the schematic diagram of the composition of the Y-factor magnitude generator. Figure 3 Y coefficient generator schematic First, the noise source is operated at the noise temperature T0 (cold state), the RF attenuator is placed at 0 (dB), the standard attenuator is placed at A0 (dB), and the indicator is indicated at a certain position; then, the noise source operates at Noise temperature Tn (hot state), adjust the standard attenuator to return the indication of the indicator to its original position. Let the attenuation reading at this time be An, then A = An - A0 (dB), the expression of the Y coefficient can be obtained as: The Y-factor method is suitable for the measurement of a wide range of noise figures. It is simple and easy to operate and requires high accuracy. It only needs to know the ENR of the noise source and measure the output noise power of the noise source in two states: cold and hot. It is not necessary to measure the gain of the DUT. Therefore, this method is used to check the accuracy of the noise figure. Experimental verification The Y coefficient obtained by equation (10) is substituted for human equation (9), and the noise figure standard value Fs is reproduced. The results are shown in Table 1. We used the AV3984 microwave noise figure analyzer for experiments. The operating frequency is 10 MHz to 26.5 GHz. The experimental block diagram is shown in Figure 4. Figure 4 experimental block diagram According to the experimental instrument shown in Figure 4, the noise figure performance of the AV3984 is ±0.25 dB. The test data is shown in Table 2. In the experiment, the standard attenuator is used to calculate the noise figure by recording the Phot value of the noise figure analyzer and substituting the following formula: The results show that the maximum deviation of the data is within 0.25 dB. The Y-factor method can measure a large noise figure range and is suitable for any frequency band, without gain limitation and higher accuracy. The intelligent noise source is used in the experiment, and the super noise ratio table can be automatically uploaded from the noise source to the noise figure analyzer, or can be uploaded by command when needed. For noise sources that require manual input of the noise ratio table, be sure to check that the used noise ratio table matches the noise source before measuring. Noise figure FS - Y coefficient value relationship table Conclusion This article discusses three methods for measuring the noise figure of a receiver. Each method has its advantages and disadvantages and is suitable for a specific application. The noise figure tester method is the most straightforward and simple, and has higher accuracy in low noise measurement. The gain method can be used in all frequency bands, especially for measuring high noise figure, but limited by the noise floor of the spectrum analyzer; the Y coefficient method is suitable for all The system noise figure test has high accuracy. It can be seen through experimental verification that the deviation of the data is small and is not limited by the gain.
0.4"~0.95" speaker (10~24mm)
1)0.4" Speaker 10Mm Speaker
FAQ
Q1. What is the MOQ? 0.4" Speaker 10Mm Speaker,0.5" Speaker 13Mm Speaker,0.6" Speaker 15Mm Speaker,High Speaker Shenzhen Xuanda Electronics Co., Ltd. , https://www.xdecspeaker.com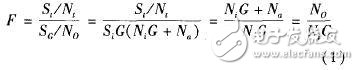
![]()
![]()
![]()
![]()
![]()

2)0.5" Speaker 13Mm Speaker
3)0.6" Speaker 15Mm Speaker
4)0.7" speaker 18mm speaker
5)0.8" speaker 20mm speaker
6)0.9" speaker 23mm speaker
7)0.95" speaker 24mm speaker


XDEC: 2000pcs for one model.
Q2. What is the delivery lead time?
XDEC: 15 days for normal orders, 10 days for urgent orders.
Q3. What are the payment methods?
XDEC: T/T, PayPal, Western Union, Money Gram.
Q4. Can you offer samples for testing?
XDEC: Yes, we offer free samples.
Q5. How soon can you send samples?
XDEC: We can send samples in 3-5 days.